Monday, May 9, 2022

IMD Uncertainty due to Distortion on Input Test Signal

Several years ago, while I was building my 500 watt solid-state HF Power Amplifier, I created an IMD test system to let me quickly perform two-tone IMD measurements as a function of swept input power (and thus a function of swept output power).

This was after I had discovered that at low to medium transmit levels the PA could have significant IMD (as shown in the image, below), and I needed a way to quickly perform distortion and gain measurements over a broad range of powers while I experimented with improving the PA's performance.

The test system consisted of two HP 3335 generators whose outputs were summed together. The resulting two-tone signal was then amplified to higher power (sufficiently high enough to drive the PA to full output) using an ENI 525LA Linear amplifier that is rated up to 25 watts output with 50 dB of gain.  

 Distortion was measured with an Agilent E4406A Spectrum Analyzer, and the system was controlled via GPIB using a MATLAB program to automate the power-sweeping and distortion measurement (see the link to my HF PA, above, for more info on the test system).

At higher powers the ENI amplifier does introduce its own IMD distortion into its output, but I already had this piece of equipment in my lab, and I decided that for my "one-off" PA design, it made sense to use equipment I already had, rather than try to purchase or build something that might be better performing but more expensive and that I might never use again.

But there is an issue using a test source that introduces its own IMD products.  If the test signal to the PA's input has distortion, these distortion products will interact with the two-tone IMD products created within the PA, with the result that the measured IMD at the PA's output might not represent the PA's actual IMD performance.

The block diagram, below, shows my IMD test system and conceptually describes the problem when IMD is present on the two-tone test signal at the PA's input:


At the time, I did not investigate any further the issue of the effect of source distortion on output distortion, but recently I came upon a thread on the eHam.net Amplifier forum that discussed IMD uncertainty and it prompted me to revisit the issue with respect to my own PA design.  (And more discussion can be found on this eHam thread (started by me):  Calculating IMD Uncertainty).

The Math of IMD Uncertainty:

As I mentioned, above, the two-tone signal (with distortion) from my ENI 525LA amplifier drives the PA.  Thus, the two tones and IMD products from the preceding ENI amplifier are amplified by the PA.  During the amplification process the PA's own non-linearities also create their own distortion products from the two-tone signal being amplified, and these products will sum (in some fashion) with the incoming IMD products from the ENI amp.

(This is a simplified description of what actually is occurring.  In addition to the PA creating distortion from the two-tone signal, there are also distortion products created by the mixing of the incoming distortion products from the ENI amplifier.  I am going to assume that these additional mixing products are at a low enough level to not significantly contribute further to the IMD at the amplifier's output.)

So, as an approximation of how the PA's internally generated IMD products interact with the incoming IMD products from my ENI amplifier, we can say that the PA's measured  Output IMD (as measured on my Spectrum Analyzer) is the sum of the PA's actual IMD (that is generated solely by the two tone test signal) plus the incoming Source IMD (i.e. the ENI amp's IMD ).

Both the measured IMD and the source IMD should be computed in terms of dBc, that is, with respect to the level of either one of the two tones of equal amplitude (if Source IMD and Measured IMD are both referenced to dBc, no additional scaling is required of the source IMD components with respect to PA gain).

If we consider the source and measured IMD components to be voltages, the Spectrum Analyzer is measuring the sum of the two:


The level of VIMDMeasured will be a function of the amplitudes and phases of VIMDActual and of VIMDSource.

The maximum and minimum values of VIMDMeasured will occur when the phase difference between VIMDActual and VIMDSource is either 0 or 180 degrees.

The images below depict a signal increasing in value due to Constructive Interference...

...and of a signal decreasing in value due to Destructive Interference:

Because the amplitude of the resulting signal depends upon the relative phase of the two signals being summed, there are a range of values that VIMDMeasured could be.  And so VIMDMeasured no longer represents the PA's actual distortion (VIMDActual).

But it is VIMDActual that we are really interested in -- the actual distortion of the PA, not the now-uncertain measured distortion of the PA.

Rearranging the above two equations, we can create two new equations representing VIMDActual and its worst-case and best-case values as a function the measured IMD and the source IMD.  These two values, representing the best and worst case possibilities of the actual IMD value, bound the region of possible values within which value of the PA's actual IMD could be.


Note two things about the best-case and worst-case equations, above, for VIMDActual.

First, VIMDSource is assumed to be less than VIMDMeasured. (Later in this post I will discuss how the 'best case' equation for VIMDActual changes for the case when VIMDSource is greater than VIMDMeasured.)

Second, note that the above equations are in terms of voltage.  Because my IMD measurements are in dB, it is necessary to convert the results back to dB for comparison purposes.  The following derivation shows how this is done:

Continuing with the derivation:


This last equation is solely in terms of IMD measurements made in dB.  Note that the left hand quantity represents the value that should be added to the measured IMD (in dB) to determine the actual IMD, in dB.

(There is MATLAB code later in this post that describes all of the mathematical steps).

We can also create a plot of the worst-case and best-case values as a function of the difference in signal levels (as either voltage or power) between measured IMD and source IMD.

The plot below graphs the two possible outputs from the equation, above.  Note that the x-axis is the value of "dBdelta",  i.e. the difference between the Source IMD and the Measured IMD. 


The above equations assume the typical case of the Source IMD being less than the Measured IMD (and thus dBdelta is negative).  But this might not be the case.  If Source IMD is greater than Measured IMD, then the Source and Measured terms must be swapped in the 'best-case' equation to prevent the argument of the log() function from becoming negative.  (The 'worst-case 'equation remains unchanged)

Therefore, if Source IMD is greater than Measured IMD, the 'best-case' equation becomes:


An Example:

Let us use as an example 80 Meter IMD measurements I made of my HF PA back in 2019:

At the same time, I also captured the IMD characteristics of the two-tone test signal from the ENI 525LA amplifier that was driving the PA's input.  

Note that the power-steps on the x-axis of the two plots, above, are exactly the same -- I generated the Source IMD plot by simply moving the Spectrum Analyzer's input from the PA's output (via a large attenuator) to a directional coupler attached to the PA's input and then I ran exactly the same test sequence (this second path is shown in the test system the block diagram earlier in this post).  

(Using the directional coupler to measure ENI 525LA distortion allowed me to capture any distortion artifacts from the ENI 525LA that might have been caused by an impedance mismatch between the ENI 525LA's output and the PA's input, and therefore not present if I had simply terminated the ENI 525LA's output in 50 ohms.)

With the captured PA input data (i.e. 525LA output) and PA output data I have all the information I need to calculate PA IMD uncertainty.

The plot below shows:
  1. Measured PA Output IMD3.
  2. Measured PA Source IMD3 (i.e. Input IMD3 to the PA's input from the EN 525LA's Output).
  3. Worst-case Actual PA Output IMD.
  4. Best-case Actual PA Output IMD.

The plot below is the same as the plot above, but I've added some data points on the four curves that correspond to a PA output of +57 dBm (i.e. 500 Watts PEP).

You can see that at 500 watts out (i.e. 57 dBm), there is almost exactly a 10 dB delta between the measured IMD of the PA and the Source (Input) IMD from the ENI 525LA amplifier.  

And the worst-case value that the actual PA IMD could be is 2.4 dB above the measured value, and the best-case value is 3.3 dB below the measured value (i.e. -3.3 dB) .

(Note that +2.4 dB and -3.3 dB are the values found for a -10 dB difference in signal level on the Uncertainty plot of best and worst case amplitudes versus relative signal level, earlier in this post .)

You can see the delta between measured IMD and worst-case 'actual' IMD increases as power approaches (and exceeds) 500 watts, due to the worsening Source (Input) IMD (yellow line).

Also, you can see that at low levels (i.e. below about 37 dBm output power) the best-case curve looks a bit wonky, and the worst-case curve begins to slope back up.  And you see the best-case curve going above the measured curve.  

Although surprising, this is to be expected, because in this region the measured Source IMD actually goes higher than the measured Output IMD.  But note that in this region we are no longer actually reading valid Source IMD numbers -- the Source IMD products have run into the noise floor of the Spectrum Analyzer, and it is the noise floor we are instead measuring.  

You can verify this by looking at the noise floor values for a given low-power point on the x axis (e.g. at 25 dBm) -- the noise floor of the Input is higher than the noise floor of the Output.  For this reason, I would recommend discounting best-case and worst-case curves at powers below which Source IMD is in the noise floor.

Below are the Best and Worst case IMD plots for my PA's 80 meter IMD3, IMD5, IMD7, and IMD9 distortion products:

Personally, I find the above plot too busy, and it can be difficult to understand what is going on.  So, recognizing that the 'best case' values are not of much use (compared to the worst case values), the plot below shows just the measured PA IMD and the worst-case values that the PA IMD could actually be.


(Note, again, that the worsening IMD at lower powers occurs because the  measured IMD product or the source IMD product has disappeared into the noise-floor of the Spectrum Analyzer).


Matlab Code:

I used MATLAB to generate the above 'uncertainty' plots from data captured with my E4406A Spectrum Analyzer.  Data was captured in terms of dB.

Below are two different methods for calculating the best and worst case IMD values.  Both give the same results.

The first method calculates the best and worst case IMD values using power (i.e. dB).

The second method calculates best and worst case IMD measurements using voltage.  This second method might be more intuitively obvious, but it does involve converting the measurements that were made in dB to volts, performing the appropriate addition or subtraction, and then, when the calculations are finished, converting from volts back to dB.

How the conversion is made from dB to volts (and then back again) is arbitrary with respect to what is chosen as reference power and load resistance.  The only rule is that the same reference power and load resistance that were used to convert from power to voltage must also be used to convert back from voltage to power.

For convenience, I chose dBm as my reference and 50 ohms as my load, simply because there are on-line calculators that allow me to quickly convert from dBm to Vrms and back again, so I could check for errors in my MATLAB calculations by compoaring with calculations I made separately using the on-line calculators.

And I set 0 dBc (i.e. the level of either of the two tones) to be equal to 0 dBm.  Therefore, at the end when I converted voltage back to dB (actually, back to dBm), the final result was identical to power in dBc.


% % *************************************************************
% % Below are two different methods to calculate IMD Uncertainty,
% % given measurable IMD distortion on a two-tone test signal
% % driving a PA-under-test.
% % Both produce the same results.
% % *************************************************************

% Uncertainty Calculation, Method 1 (in terms of dB)
% --------------------------------------------------
% Note that the IMD measurements are in dB.
%
% Calculate Best-case and Worst-case IMD possibilities given an amplifier's
% measured output IMD and the measured IMD of the source driving it.
%
function [BestCaseIMDdB,WorstCaseIMDdB] = IMDuncertainty(IMDsourcedB,IMDoutputdB)
    IMD_delta = IMDsourcedB-IMDoutputdB; % neg. if source IMD < Output IMD
    expTerm = 10^(IMD_delta/20);         % Vsource/Voutput
    % Next, dB of sum of Source and PA-Output IMD voltages,
    % referenced to PA-Output's IMD voltage.
    dB_of_sum = 20*log10(expTerm + 1);
    WorstCaseIMDdB = IMDoutputdB + dB_of_sum;
    if IMD_delta > 0  % Source IMD level > Measured Output IMD level
        dB_of_difference = 20*log10(expTerm - 1);   % delta to Output IMD
        BestCaseIMDdB = IMDoutputdB + dB_of_difference;
    else
        % Source IMD level <= Measured Output IMD level
        dB_of_difference = 20*log10(1 - expTerm);   % delta to Output IMD
        BestCaseIMDdB = IMDoutputdB + dB_of_difference;
    end
end

% Uncertainty Calculation, Method 2 (in terms of voltages)
% --------------------------------------------------
% Note that the IMD measurements are in dB.
%
% Calculate Best-case and Worst-case IMD possibilities given an amplifier's
% measured output IMD and the measured IMD of the source driving it.
%
% In order to calculate voltage from power, the IMD measurements are
% assumed to be in dBm (referenced to 50 ohms), but this definition is
% arbitrary!  The final results would be the same irrespective of
% reference power (e.g. 1 mW), or assumed load resistance (e.g. 50 ohms).
%
function [BestCaseIMDdB,WorstCaseIMDdB] = IMDuncertainty(IMDsourcedB,IMDoutputdB)
    % First assume 0 dBc equals 0 dBm as a convenient, yet arbitrary
    % reference.  Convert powers (measured in terms of dBc, now dBm)
    % to voltages:
    Vsource = (10^(IMDsourcedB/10)*50*0.001)^(1/2); % convert dBm to V
    Voutput = (10^(IMDoutputdB/10)*50*0.001)^(1/2); % convert dBm to V
    Vactual_WorstCase = Vsource + Voutput;
    % convert V to dBm (actually dBc)
    WorstCaseIMDdB = 10*log10((Vactual_WorstCase^2)/(50*0.001));
    if Vsource > Voutput  % Source IMD level > Measured Output IMD level
        % subtract Vouput from Vsource, to keep the log argument positive
        Vactual_BestCase = Vsource - Voutput;
        % convert V to dBm (actually dBc)
        BestCaseIMDdB = 10*log10((Vactual_BestCase^2)/(50*0.001));
    else
        % Source IMD level <= Measured Output IMD level
        % subtract Vsource from Voutput, to keep the log argument positive
        Vactual_BestCase = Voutput - Vsource;
        % convert V to dBm (actually dBc):
        BestCaseIMDdB = 10*log10((Vactual_BestCase^2)/(50*0.001));
    end
end
Note:  If you are viewing the code on a small screen, you might not be able to see the full length of the lines of code.  In this case, cut-and-paste the code into an application with a larger viewing pane (e.g. Notepad, Word, etc.).

Resources:

These two application notes discuss IMD Uncertainty (as it relates to Spectrum Analyzer IMD measurements and IMD generated within the Spectrum Analyzer, itself):

Interaction of Intermodulation Products between DUT and Spectrum Analyzer, Rohde & Schwarz

Dynamic Range Optimization for Distortion Measurements, Keysight Technologies


Standard Caveat:

As always, I might have made a mistake in my equations, assumptions, drawings, or interpretations.  If you see anything you believe to be in error or if anything is confusing, please feel free to contact me or comment below.

And so I should add -- this information is distributed in the hope that it will be useful, but WITHOUT ANY WARRANTY; without even the implied warranty of MERCHANTABILITY or FITNESS FOR A PARTICULAR PURPOSE.


Thursday, May 5, 2022

Schematic, Amazon Relay Module: 1 Channel, Optocoupler Isolation Hi/Low Trigger

A ham radio friend (Dan, KA6RCZ) recently purchased an inexpensive single channel relay module (made by HiLetgo, in this instance) from Amazon, and he wanted to know if it would work in an application he had planned.  

Because of local high noise at his location, Dan uses a remote webSDR site (KFS) through his PC for the receive side of his communications, and he wanted some way to turn off the PC's audio (to an external speaker) whenever he was transmitting.

Unfortunately, the module came with no documentation, and so to verify if it would work in my friend's application, I decided to draw its schematic.

This schematic was created from tracing out the circuitry of the 12 V version of the module, but it is probably applicable to the other voltage versions of the same module (e.g. the 5V relay module), assuming that the only change between different modules is the voltage rating of the relay.


Note that when the jumper is in the 'H' position, the relay turns ON when the IN voltage is raised to about 1.5 V above ground (i.e. 1.5 V above the voltage at the DC- connector).  This threshold should be independent of the spec'd relay voltage, assuming that the only component that changes between different voltage-rated modules is the relay.  

So, for example, a 5V relay module should turn on when the IN voltage is above about 1.5 V (note: IN voltage level referenced to the DC- pin). 

When the jumper is in the 'L' position, the relay turns ON when the IN voltage is less than about 1.5 V below DCV (where 'DCV' is the DC voltage applied to the module between the DC+ and DC- inputs).  

So, for a 5V relay module with 5 VDC applied between the DC+ and DC- connectors, I'd expect the relay to turn ON when the IN voltage is less than about 3.5 V (note:  IN voltage level referenced to the DC- pin).


A Circuit for Dan's Application:

I drew the connection diagram, below, for Dan's webSDR application.  


Please note the following:

  1. An Icom 7300 controls the relay module's on/off state using the radio's back-panel "SEND" jack.
  2. The module's JUMPER should be in the 'L' (not 'H') position.
  3. DC power to the module is assumed to be 13.8 VDC (i.e. the same voltage as the radio's power).
  4. An optional series Capacitor and Resistor can be added between the module's IN and DC-  terminals to delay when the module turns off at the end of TX.  This delay is to prevent you from hearing the end of your transmission when you transition back to RX (there is typically a delay in the webSDR audio). The value of the capacitor sets the "release" delay (47 uF gives roughly 300 msec of delay), and the resistor limits the current into the SEND jack at the start of TX, when the capacitor discharges (the SEND jack is rated at 0.5A, max).


Standard Caveat:

As always, I might have made a mistake in my equations, assumptions, drawings, or interpretations.  If you see anything you believe to be in error or if anything is confusing, please feel free to contact me or comment below.

And so I should add -- this information is distributed in the hope that it will be useful, but WITHOUT ANY WARRANTY; without even the implied warranty of MERCHANTABILITY or FITNESS FOR A PARTICULAR PURPOSE.

Tuesday, April 12, 2022

Repair Log: HP 3314A, Part 2

This post is part 2 of my HP 3314A Function Generator troubleshooting posts, in which I continue troubleshooting my swap-meet find.  

Part 1 is here.


Battery Replacement:

The HP 3314A contains a Lithium battery to keep power applied to the CMOS RAMs (U211 and U212) and to the Reset Circuitry (U203, an MC14584B Hex Schmitt Trigger IC) when the 3314A is powered off.

 The image below shows the dead battery that was in the 3314A when I purchased it.  Although not easily seen in the picture below, there are two wires attached to the PCB that are pushed against the ends of the battery, but they are not soldered to it.  So electrical contact with the battery's terminals depends upon the physical pressure of the two wires against the battery's ends. 

My guess is that the two wires attached to the PCB wereleads that were part of an older, originally installed by HP, battery, and a previous owner simply clipped these two leads from the ends of that original battery and then pressed them against the terminals of a modern replacement battery that did not have wires attached to it, hoping that this physical contact would provide a reliable electrical contact.

I purchased a CR123A battery holder and new 123-style Lithium 3 volt battery via Amazon and, after removing the original two wires on the board, I used two new wires to connect the holder to the PCB.  This assembly is held in place with a tie-wrap.


ROM Failure:

Even with the bad CMOS RAM temporarily replaced (see Part 1), the unit would still end up with a blank seven-segment display after the power-up count-down sequence.  Why was the microprocessor failing to continue?

Perhaps there's another memory failure.

Fortunately, HP included a number of self-tests in the HP 3314A.  One of these is a memory test, which verifies the contents of the ROM memory (of which there are six ROMs in my early version of the 3314A (U207-U210, U236, U238)), as well as the RAM (U233, U234) and CMOS RAM (U211, U212; these last two being the battery backed-up RAM).

This memory test can be invoked by holding down the ARB button while turning on the 3314A.  It can take 20 to 30 seconds to complete, and, when finished, it will display which memory devices test GOOD by turning ON a front-panel LED for each good device.  If the associated LED is OFF, then the memory device failed the test.


When I invoked this test, the AMPLITUDE LED remained OFF, signifying that U236 was bad.

(Note -- when I first tried to invoke this test, prior to replacing U212 (the bad CMOS RAM IC), all of the LEDs would turn OFF and the test would never finish.)

Pinout-wise, the six on-board ROMs seem equivalent to 2364 ROMs.  These are 8Kx8 bit memories.  I have 2764 EPROMs in my junk box (from designs I did 40 years ago) that are also 8Kx8 devices.  Could I program one of my EPROMs to replace the bad on-board ROM?

But first, were the 3314A ROM binary files even available?  

A query to the HP/Agilent/Keysight groups.io site (https://groups.io/g/HP-Agilent-Keysight-equipment) quickly got a reply to take a look at the Ko4BB web-site, which has files for both the early version of the 3314A (like mine) which had six 8Kx8 ROMs, and the later revision which had a single 64Kx8 ROM.

So binary files were available, but one more issue remained -- the original ROMs were 24 pin devices, but the 2764 EPROM is a 28 pin device.

I could wire up an adapter board, myself, but fortunately, one can purchase adapter boards for this purpose, and eBay had just the thing.  (Apparently this was a common modification for the Commodore computer -- search for "2364 EPROM Adapter").

Here's a photo of the adapter kit I purchased from eBay (this photo is from the eBay listing):


Note that pin 27 of the 2764 EPROM (its /PGM pin) should be tied to VCC for normal READ operations.  This pin is not normally tied high on the adapter board, but the board does include pads to accomplish this -- I simply applied a solder-short from the "A14" pad to the "VCC" pad (these pads are visible in the center of the board in the image, above).

Pin 26 of the 2764 EPROM should remain floating (No Connection).  Note that this pin corresponds to the "A13" pad on the adapter board, and it should remain unconnected.

With the adapter built and an EPROM programmed (using an inexpensive TL866A PROM Programmer, available, for example, via Amazon), I soldered the adapter to the PCB in place of the original ROM and inserted the programmed PROM into its socket.


I powered up and...hurray!  The seven-segment display did not blank out after the initial count-down following power up!  

And when I invoked the Memory Test at power-up, all memories passed.

But there were still problems -- now the unit displayed the following errors during its power-on calibration procedure:

E30 (No Frequency Detected)

E34 (Signal Amplitude Outside Measurement Range)

So on to the next problem...


Error E30:  No Frequency Detected:

The Service Manual has a flowchart for troubleshooting Frequency Calibration errors.  Following this chart led me to the box labeled "Common Mode Rejection Circuitry":


The Common Mode Rejection Circuitry is part of the "Triangle Integrator" schematic, below.  The purpose of this circuitry is to keep the DC level at the Source Pins of Q220 (i.e. pins 1 and 5) at about -5 Vdc.  

On my board I measured the "Common Mode Sense" voltage (at the base of Q211) to be -3.4 volts, not the specified -5 volts.  Clearly there was a problem.  But was the problem actually with the common-mode circuitry, or was it somewhere else, with the symptoms exhibiting themselves as a common-mode problem?


(Important Sidebar Note:  Although the Service Manual shows voltages at Q220 pins 1 and 5 having a DC offset of -5 Vdc (Waveform 1, Figure 8-15, although good luck discerning this level from the manual download from the Kesight site), these two voltages can actually be a bit lower than -5 Vdc (e.g. -5.4 Vdc), due to Q211 base current, even if the "Common Mode Sense" signal at the base of Q211 is -5 Vdc)).

But back to the problem -- why was the Common Mode Sense level so far off?

First, I needed to understand the circuit, starting with the Triangle Integrator circuitry.  

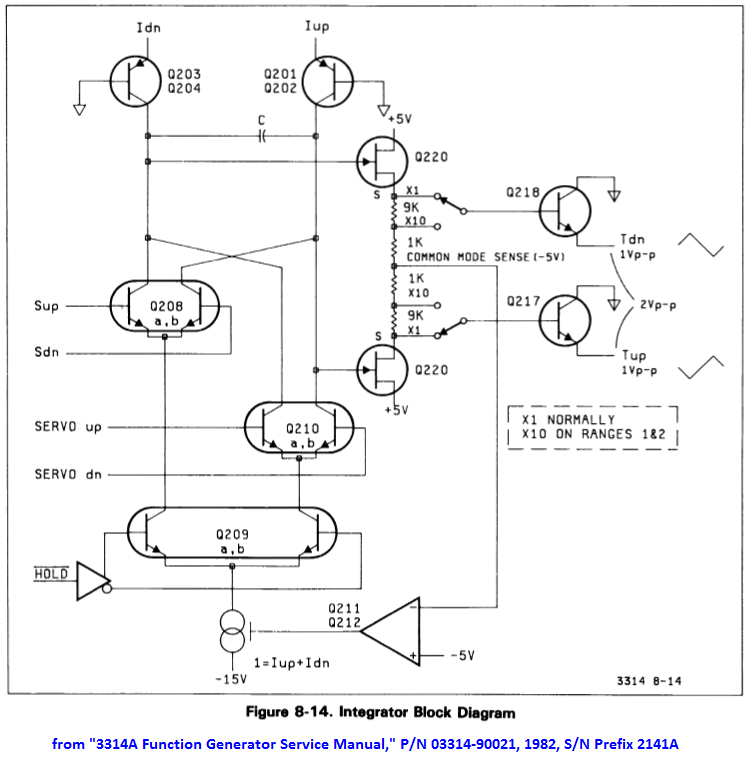
The functional operation of the Triangle-wave generator can be understood using the block diagram, below.  


First, note that in normal operation (e.g. the generator's state after power-up), the path through the Q210 differential pair is not used.  Instead, Q208 controls the generation of the triangle wave.

Basically, a constant current is passed through the capacitor C (connected across the collectors of the two differential pairs Q208 and Q210), first charging the capacitor in one direction (Iup and Idn both passing through, for example, the left-hand transistor of the differential pair, Q208a, with Iup charging the capacitor).

A downstream comparator (not shown in the block diagram, above), monitors the voltage across the capacitor and, when this voltage reaches a threshold, it flips the states of the Sup and Sdn control signals, forcing the capacitor to charge in the opposite  direction (i.e. via Idn, with both Iup and Idn now passing through Q208b).

If everything is working properly, this flipping back and forth of the charging path should result in a 1 volt peak-to-peak triangle waveform at the output of the Triangle Integrator circuitry (i.e. 1 Vpp at the emitter of Q217 and 1 Vpp at the emitter of Q218).  And because Q217 and Q218 are emitter followers) the same peak-to-peak levels should be seen at each of Q220's two Source pins (pins 1 and 5).  

But when I measured the signals at  Q220's Source pins, there wasn't a 1 Vpp signal present on either pin. Instead, one Source pin (pin 1) was stuck at 0.7 Vdc, while the other Source pin (pin 5) was sitting at -7.5 volts.


The voltage delta between these two pins was 8.2 Vdc (much greater than the 1 volt delta it should have been).  And it was because of this excessive voltage delta that the Common Mode Sense voltage measured to be -3.4 Vdc and not the desired -5 Vdc (the Common-Mode Sense voltage, assuming that Q211's base current is insignificant, is a function of the voltage divider consisting of  R233, R234, R237, and R23 connected in series between the two Source pins of Q220, and thus this voltage should equal the average of the voltage between these two pins (i.e. (0.7 + (-7.5))/2 = -3.4 V).

So why was the voltage delta between the two source pins so large?  And why weren't the transistors in the Q208 differential pair flipping  back and forth to create the triangle wave?  Was there a problem with the triangle generator, or maybe the comparator?

This was looking a lot less like an issue with the Common Mode Rejection circuitry and instead an issue somewhere else.

Probing the circuit's transistor voltages gave me some very strange results when I looked at transistor voltages in aggregate, but after digging a bit further I found that my confusion was, in fact, caused by a schematic error in which the transistor reference designators for Q208a and Q208b were swapped, compared to the labels on the PCB silkscreen.  The correct reference designators are shown, below:


With that schematic issue resolved, the measured Integrator's voltages now made sense, and the problem would seem to be further downstream, at the comparator.  (It is the comparator that flips the Sup and Sdn signals back and forth, which in turn control the charging direction of the integrating capacitor via Q208a or Q208b).

While troubleshooting the comparator's voltages I ran into another documentation error -- this time in the Comparator Block Diagram:


(And although it is not shown in this blog post, Figure 8-19 has the same pin errors.)

As I probed the DC voltages of U303 (a CA3102 dual differential amplifier IC) it quickly became apparent that something was really messed up.  For example, the device's Substrate pin (pin 5) was sitting at -4 Vdc instead of -15 Vdc.  The substrate pins voltage should be the lowest voltage on the chip, and it clearly was not (see the voltages in the image, below).


Also, the current into pin 11 (transistor base current) was a whopping 33 mA!

It looked like U303 was bad, but I didn't have any replacements in my junkbox.  Fortunately, I found some on eBay and ordered a couple.  But in the meantime I decided to make a simple replacement for the CA3102 using six discrete 2N3904 transistors to replicate the CA3102's two differential amplifiers.  It wouldn't be perfect -- the 2N3904 transistors weren't matched and their fT is much lower than that of the CA3102's transistors, but hopefully I could continue with my troubleshooting while awaiting the arrival of the CA3102 devices.

(Sidebar:  Interestingly, the CA3102 was already mounted in a socket.  I don't know if HP did this during manufacturing, or if someone later modified the board and added the socket.  If the former, maybe the CA3102 devices needed to be hand-selected to get the required performance.)

Below is an image of my "Temporary CA3102" replacement, using six 2N3904 transistors and built onto a 14-pin DIP header that, in turn, is plugged into a 14-pin socket at U303's location on the PCB:


With this temporary replacement installed on the PCB, there were no longer any "E30" errors at power up, and there was now a sine wave present at the 3314A's output!

But, even though there was now a sine wave output, there were still errors displayed at power up.  These errors consisted of one E31 error (frequency error exceeds correction capability) and four E34 errors (signal amplitude outside measurement range) that were displayed during the calibration sequence.

So on to the next problem...


Error E34:  Signal Amplitude Outside Measurement Range:

Error E34 identifies the signal amplitude as being "outside measurement range."  But what is "outside measurement range"?  

Unfortunately, the Service Manual seems to be mute on this error condition, but, if I measured the 3314A's output (across a 50 ohm load) with the 3314A's amplitude set to 1.00 volts (peak-to-peak) and 0 volts DC offset, the output level and offset were clearly not what they should have been, as the image below shows:


With the output amplitude set to 1.00 volts and no DC offset, the voltage across a 50 ohm load  measured to be 0.88 Vpp with an offset of -0.24 Vdc, not the desired 1.0 Vpp with 0 Vdc offset.  

Clearly there was a problem.

Because E34 is an "Amplitude Calibration" error, I decided to follow the Service Manual's "Amplitude Calibration Troubleshooting Flowchart" (figure 8-11B).

Following its flow and making the recommended measurements at the appropriate steps, I arrived at its conclusion that, "Maybe U502 or associated cells/circuits" were at fault.


Well, that's pretty vague.

And what is U502?  It is HP's custom "Sine Shaper" IC that converts the triangle wave into a reasonable facsimile of a sine wave.  If this part were bad, then I might as well abandon the project, because it was sure to be "unobtanium."

But it was too early to abandon hope, so I started troubleshooting by first examining U502's signals.

Well, U502's signals "seemed" good, in the sense that nothing was obviously out of whack, but there wasn't much information in the Service Manual as to what U502's signals should actually look like.

Assuming (hopefully) that U502 wasn't the issue, could the problem be in an earlier stage?  For example, I had noticed that the DC levels at the Integrator circuit's Q220 Source pins were about 0.4 volts lower than the image for the waveforms shown in the Service Manual (i.e. they measured at -5.4 volts instead of -5 volts), as shown, below:


Could this offset be the problem?  A quick test (raising the Source voltages of Q220 from -5.4 to -5 volts by paralleling R219 (in the Q211, Q212 circuit) with a variable resistor) showed that changing this DC offset had absolutely no effect on the 3314A's output voltage level or offset.

Hmmm, could the problem be in the next stage, the Transconductance Amplifier?

Did not seem so.  DC voltages seemed reasonable, and signal levels at the bases of Q203 were correct.

So the signals going to the Sine Shaper seemed to be reasonable, at least as far as I could determine (which was not very far).

Again, hoping that the Sine Shaper IC was not the issue, perhaps the problem was in a stage following it.

The Sine Shaper drives the "Preamplifier" Stage (Figure 8-23 in the Service Manual), which in turn drives the "Output Amplifier and Step Attenuator" stage, whose output, in turn, goes to the output connector on the front panel.

As I measured the DC levels of the Preamplifier from input to output, they looked OK...but wait!  The node common to R611, R612, R606, R607, and R608 measured at 0 Vdc (which makes sense, as this should be the DC level of a balanced amplifier when there is no DC offset), but the DC voltage at the other side of R607 (i.e. at connector J1 to the Output Amplifier's input) was at -0.24 volts.


What happens to the DC level at the Preamplifier's J1 connector if I disconnect the cable between J1 and the input to the Output Amplifier?  The DC voltage at the output side of R607 goes to 0 Vdc, and the sine wave amplitude increases such that, when this point is terminated with 50 ohms, its amplitude is correct.  

That is, with the Preamplifier's output disconnected from the input of the "Output Amplifier" stage, and with the 3314A's amplitude set to 1 Vpp and 0 Vdc offset, the sine wave at the Preamplifier Output (terminated with 50 ohms) correctly measures to be 1 Vpp with 0 Vdc offset, instead of the 0.88 Vpp with -0.24 Vdc offset that would have been measured at the output of the Output Amplifier.

So the Output Amplifier would seem to the be culprit!  Here is an image of that board:


While probing the Output Amplifier's DC voltages, it quickly became apparent that Q10 was bad (an MPSH10 NPN transistor -- its Vbe measured to be 3.7 V).


I replaced Q10 and powered up the unit.  Success!  There were no longer any E34 errors during power-on calibration.


Important Note:  The scanned copy of the schematic for the "Output Amplifier and Step Attenuator" board in the downloadable Service Manual on the Keysight site (see Resource list, below) is missing some circuitry, which I've shown in the image, below (copied from a later manual revision):


Conclusion:

With all fixes installed, the 3314A's Calibration Sequence (initiated at power-up) successfully completes with no displayed errors.  And it plays the Hallelujah Chorus! (See here for an example).

I have not done any of the Performance Tests listed in the Service Manual.  I might do these at some future date, at which point, if there are any issues that need repair, there might be a Part 3 added to this 3314A troubleshooting series.

Finally, note that all troubleshooting was done without the benefit of a Signature Analyzer.  However, if there had been problems with the digital logic, a Signature Analyzer (e.g. HP 5004A) would have been invaluable.


Other Notes and Comments:

1.  E31 Error:

The E31 error (that began appearing during the Power-up Cal sequence after I had replaced the bad U303 (CA3102) with my temporary "six 2N3904" replacement), disappeared when I replaced the U303 temporary fix with an actual CA3102 device.

2.  Replacing the CMOS RAM with higher-current devices:

If uPD444 CMOS RAMs are not available for replacing U211 and/or U212, other 1Kx4 devices can be used, if they are pin compatible.  Note, though, that if the new RAMs require higher Vcc current, then to prevent battery drain their power pins should not be attached to their respective pin 18 PCB pads (which are powered by the battery when AC power is OFF).     

Instead, lift the power pins (pin 18) of the two devices and connect these two lifted pins to +5 Vdc at the "front-panel" side of C17, as shown in the image, below (the example, below, uses two Intel D2148H RAMs in lieu of the two original NEC uPD444 RAMs):

With this modification, the CMOS RAM will no longer retain stored information when the 3314A is turned off.  And thus there will be an "E09" error (non-volatile memory lost; battery down), displayed at the end of the Power-up calibration sequence, every time the 3314A is powered up.


Resources:

HP 3314A Manuals:  https://www.keysight.com/us/en/support/3314A/programmable-function-generator.html

HP 3314A Repair in 3 parts:  https://diysquared.blogspot.com/2021/04/fixing-hp-3314a-function-generator-part.html

HP 3314A Repair on YouTube:  https://www.youtube.com/watch?v=wNxgBubSfH8

HP 3314A Repair (on Antique Radios forum):  https://antiqueradios.com/forums/viewtopic.php?f=8&t=360491

HP 3314A Teardown (EEVblog):  https://www.eevblog.com/forum/testgear/hp-3314a-function-generator-teardown-explanation/

HP 3314A Playing the Hallelujah Chorus:  https://www.youtube.com/watch?v=H90d6sPUF6A
(Note:  Hold down FUNCTION (the blue key), SW/TR INTVL, and START FREQ while powering up the unit).

HP 3314A ROM Images:  http://www.ko4bb.com/getsimple/index.php?id=manuals&dir=01_ROM_Images_and_Drivers/HP_3314A_Eprom


Standard Caveat:

As always, I might have made a mistake in my equations, assumptions, drawings, or interpretations.  If you see anything you believe to be in error or if anything is confusing, please feel free to contact me or comment below.

And so I should add -- this information is distributed in the hope that it will be useful, but WITHOUT ANY WARRANTY; without even the implied warranty of MERCHANTABILITY or FITNESS FOR A PARTICULAR PURPOSE.

Tuesday, March 29, 2022

Repair Log: HP 3314A, Part 1


At a recent swap-meet I came across an HP 3314A Programmable Function Generator that was described as non-operational but was physically in good shape.

In my opinion, HP cases make great project boxes (see here, here, and here), and this case looked like it would be an excellent case for a future, yet-to-be-defined project.

And so I made an offer based solely on the idea of scrapping the 3314A's electronics but keeping its case and internal chassis.  The offer was accepted, and the 3314A came home with me.

But after I had returned home, I had second thoughts about my plan to scrap the unit.  Why not try to fix it, if that were possible?

And thus this blog post, which describes my efforts to bring this HP 3314A back to life.


Initial Power-On Error:

The first problem I came across was at power-up -- the unit would cycle through its initial count-down following power-up, and then it would hang.  The count numbers displayed during the Power-up cycle would often also be screwed up.  And at the end of this cycle, sometimes the 3314A would hang with the LED numerical display being blank, and sometimes the display would show Error Codes E13 or E43.

Looking in the manual (section 3-1), Error Code E13 does not exist, and, although Error Code E43 exists, it is an HP-IB Error Code meaning "Invalid Data."  Given that the instrument was not in Remote mode (i.e. HP-IB mode), the display of this last error code could be meaningless and a result of some other error.

Note that immediately following power-up, the unit's 3-digit numerical display should show the following sequential count-down:

999
888
777
666
555
444
333
222
111
000

The video, below, demonstrates the Count-down problem:

You can see from the video that the displays are changing, so the 3314A is attempting this count-down, but the digits of the first counts are screwed up.

But before I go any further...

A quick note on my initial trouble-shooting:

The HP Service Manual (downloadable from the Keysight website: HP 3314A Manuals) recommends trouble-shooting using Signature Analysis.  Unfortunately, I was at my wife's place in Nevada City, CA, at the time of this initial trouble-shooting, and my Signature Analyzer was back at my house in Silicon Valley, CA.

(Plus, the SA unit has been sitting in a box, untested, for at least 20 years (another swap-meet find), and I had no idea if it worked, or not, as I've never had a need to use it!)

So, this initial phase of trouble-shooting was done with a 2-channel oscilloscope...


Probing the Front Panel Assembly:

Because segments of the LED seven-segment displays were either being incorrectly kept off or, alternately, incorrectly illuminated, it made sense to start my trouble-shooting at the Keyboard assembly where the seven-segment displays reside.

But I immediately encountered several issues.  The first issue is that the HP schematic has a number of errors.

The image, below, shows my corrections, in red.  You can see that U1's (74LS273) inputs were incorrectly assigned.  Also, the pin number of the LED displays are incorrect.

Here's a closeup of U1.  Its correct pin number assignments are shown in red:

And here's a closeup of the correct seven-segment display pinout (in red):

(Note that I also corrected the names of the three signals driving the common-cathode pins of these three displays to match the net names assigned to their respective drivers.)

The image below shows the correct pin number (in red) and the associated data bit from the 8-bit bus (in blue) for each segment of the LED.

When count-down sequence first starts, the first count presented on each seven-segment display is '9', and then this number counts down (8, 7, 6, etc.).  The numbers are the same on all three seven-segment displays, so the displayed numbers should be, in sequence, 999, 888, 777, 666, 555, etc.

Thus, the segments of the seven-segment display associated with data-bits DL0, DL1, DL2, and DL3 should be ON for the first count-down digits (9, 8, 7...), but, as you can see in the video, above, they are OFF.  These will later turn ON for lower counts (e.g. 3, 2, 1, 0), but at the start of count-down they are OFF.

The image below shows the problematic segments (highlighted in yellow):


The Keyboard assembly is a multiplexed system with the segments of the seven-segment displays sharing the same "row" signals (as in a row-column matrix) as the other front-panel LEDs.  Thus, probing a segment to see if it is correctly turning on or off can be a bit of a challenge with a two-channel scope, especially with the count-down's count quickly changing as it counts down.

But by observing U1's outputs (the 'LS273) responsible for driving the numerical segments immediately after power-on, it was clear that U1's outputs were not being set to the correct state to drive these segments ON for the first few counts (a U1 output bit must be set LOW to turn ON a segment).

Tracing this failure back...the data at U1's inputs, arriving at the Keyboard from the Controller Board,  was also in the incorrect state for these counts.  Thus, U1 was simply passing on incorrect data from the Controller Board.

So time to move the probing to the Controller Board...


Probing the Controller Board:

At the controller board I started at the processor, looking at its Data Bus while triggering the scope on the rising edge of the clock clocking data into the U1 register on the Keyboard assembly.  This probing showed that the data from the microprocessor that was being written to the Keyboard assembly was also incorrect.

So why was the processor writing incorrect data?  Was it getting bad data from the PROMs (of which there are six)?  Or was RAM bad?  Or was something fighting the bus when the processor was attempting to read or write this data?

Even though I did not have a Signature Analyzer, I decided to invoke one of its tests (SA Test #1, in which switches 1, 2, 7, and 8 are turned ON), because I assumed this test would sequentially count through all of the microprocessor's addresses and I could look for errors either on the Address Bus or on the Data Bus during this time.

Everything was looking good until I got to the CMOS SRAM, U211 and U212 (NEC UPD444/6514 1Kx4 bit CMOS RAM).  The four data I/O pins of U212 had flaky looking levels for some of its read cycles.  Plus, these flaky levels would change with time.  

The image below (lower scope trace) shows the levels one of these pins (pin 11, or I/O4).  U212's outputs are enabled whenever the upper trace is low.


Compared to U212, the I/O pins of U211 looked fine -- it was only U212's four data pins that had the issue.  And these four data bits correspond to the low-order four bits of the Data Bus, which were the problem bits driving the Keyboard's seven-segment displays.

Could a bad U212 be the culprit?  I placed an order of a pair of new NEC UPD444 RAMs on eBay, but while waiting for them to arrive I thought I'd continue testing...

By the way -- the HP manual has some errors regarding SRAM power on the Controller Board.  My corrections are shown, below, in red:


Excessive Battery Current Drain:

After ordering replacement UPD444 CMOS SRAM from eBay, I decided to look around a bit more and see what other problems I could find while waiting for the SRAM to arrive.

One issue I had noticed when I first opened up the unit was that the battery backup was dead (the battery was sitting at about 0.45 volts), yet it was a fairly new battery (with a 2023 date).  Could it have been killed by excessive current draw?

Note that this battery serves two purposes:

First, it keeps power applied to U203 of the RESET circuitry (CMOS inverters), even when power is OFF, so that the RESET line can be properly driven when power is first applied.

Second, the battery provides power to U211 and U212 (the CMOS SRAM), to maintain the contents in these two SRAM chips even when the unit is powered OFF.

Per section 5.2 of the manual, battery current drain when power was off should be on the order of 1.35 uA (typical) to 18.5 uA (max), when measured as an equivalent voltage drop across R13, a 1K ohm resistor -- e.g. 1.35 uA of current would equal 1.35 mV across R13).

Replacing the dead battery with a bench supply set to 3.0 volts, I measured 0.495 volts across R13 -- in other words, current draw was 495 uA, not the spec'd 18.5 uA max!

No wonder the battery was dead!

The battery-power circuit is fairly simple, which means there weren't many suspects.  And because U212 (one of the two CMOS SRAMS) was on my "hit-list" of suspected bad parts, I decided to clip its VCC pin (pin 18) and see what happened to battery current.  

With the pin clipped (i.e. no VCC applied to U212), the voltage across R13 dropped way down (below the level that my Fluke DVM can measure) -- clearly U212 was the culprit!  


U212 Temporary Replacement Test:

OK -- two different tests pointed to U212 being bad.  Was there some way that I could verify this while waiting for my eBay UPD444 CMOS RAM to arrive?

A friend gave me a National MM2114N-L 1Kx4 bit RAM from his junk box.  This device draws more supply current than the original NEC part, so it would not be a satisfactory permanent replacement for the UPD444, but I thought I would give it a try to test my theory that it was U212 that caused the count-down errors.

So I removed the original part, installed an 18-pin socket in its place, and inserted the '2114 in its place (also, the battery had been removed, too (it was dead) -- if the battery had been good, though, the MM2114N would have presented a much larger than expected current drain, and I would have removed it before doing this test).

I turned power on, and...nothing.  The seven-segment displays remained dark!

Probing with the scope, I quickly discovered that with power ON, Vcc at the '2114 was around 3 volts, not the expected 5 volts.  

Power to the CMOS RAM is a diode-OR'd combination of Vcc (via CR2, when the unit is powered up) or the Battery voltage (via CR3, when the unit is powered down and the CMOS RAM thus battery-powered).

There is a 49.9 ohm resistor (R17) in series with CR2.  The Vcc current of the '2114 RAM was enough to create a significant voltage drop across this 49.9 ohm resistor.

The obvious temporary solution was to short out the resistor for this test, which I did.


Powered the unit back ON, and the count-down was now correct!  Therefore, the count-down problem was caused by a bad U212 CMOS RAM IC.

Here's a video of the correct power-up countdown, with the MM2114N-L as the temporary replacement for U212:


Even thought the count-down is now correct, the unit still fails at the end of the count-down, either by blanking the seven-segment displays (as shown in the video, above) or showing (sometimes briefly) the two error codes mentioned above.


(An interesting question (unanswered) is why did HP add R17 in series with CR2?  My guess is that it has to do with current-limiting CR2's current at power-up, but why?  Note, its P/N is 1902-0535.  With 50 ohms in series and assuming a direct short from CR2's cathode to ground at power-up, CR2's initial current surge would be around 100 mA. Is the Schottky diode that sensitive to a temporary current surge?).


More Troubleshooting continues in Part 2!


Other Manual Issues:

Another Keyboard schematic error:  There are no net names assigned to the inputs of the four U5 drivers ('LS05 devices), so it is impossible to tell which output they actually connect to.


Resources:

HP 3314A Manuals:  https://www.keysight.com/us/en/support/3314A/programmable-function-generator.html

HP 3314A Repair in 3 parts:  https://diysquared.blogspot.com/2021/04/fixing-hp-3314a-function-generator-part.html

HP 3314A Repair on YouTube:  https://www.youtube.com/watch?v=wNxgBubSfH8

HP 3314A Repair (on Antique Radios forum):  https://antiqueradios.com/forums/viewtopic.php?f=8&t=360491

HP 3314A Teardown (EEVblog):  https://www.eevblog.com/forum/testgear/hp-3314a-function-generator-teardown-explanation/

HP 3314A Playing the Hallelujah Chorus:  https://www.youtube.com/watch?v=H90d6sPUF6A
(Note:  Hold down FUNCTION (the blue key), SW/TR INTVL, and START FREQ while powering up the unit).

HP 3314A ROM Images:  http://www.ko4bb.com/getsimple/index.php?id=manuals&dir=01_ROM_Images_and_Drivers/HP_3314A_Eprom


Standard Caveat:

As always, I might have made a mistake in my equations, assumptions, drawings, or interpretations.  If you see anything you believe to be in error or if anything is confusing, please feel free to contact me or comment below.

And so I should add -- this information is distributed in the hope that it will be useful, but WITHOUT ANY WARRANTY; without even the implied warranty of MERCHANTABILITY or FITNESS FOR A PARTICULAR PURPOSE.